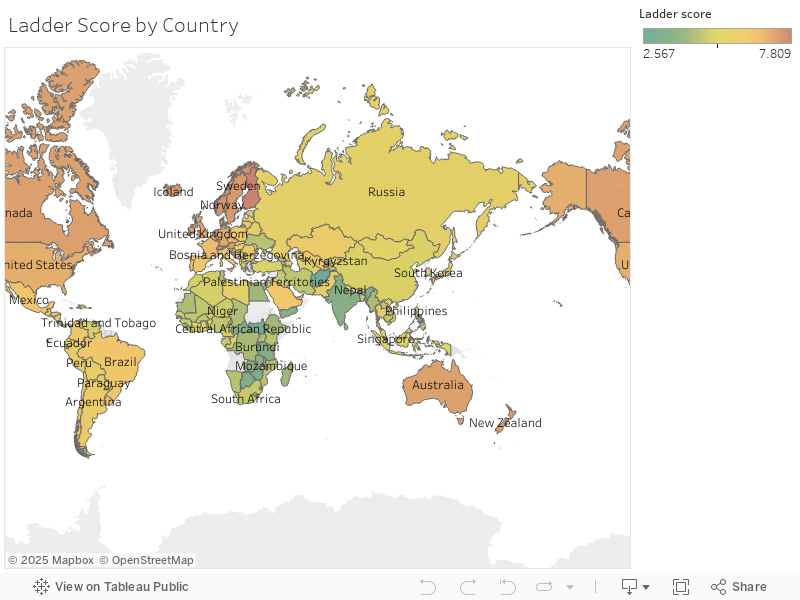
This map illustrates why we wanted to explore our research questions. This map depicts each country’s ladder score with red/orange (warmer colors) indicating a higher ladder score and blue/green (cooler colors) indicating a lower ladder score. That graph reveals how the happier countries are disproportionately placed in Northwestern Europe and North America, with the least happy countries being placed in Southern Africa and the Middle East.

The bar chart shown above depicts Country Freedom to make life choices vs. Country GDP Ratio. The two charts compare and contrast to see if there is any correlation between the two variables. For the purpose of this graph and limited space only a select few countries were chosen, most by random but with the exception of the subjects of this project, the Nordic Countries. Noticeably the graph does begin to show that in the Nordic countries Freedom to make life choices and Country GDP are almost identical. Therefore it is safe to assume that there may be a slight association between the stability of these two topics and the correlation of overall happiness within these countries. As expectedly, countries with higher ladder scores tend to have higher GDP as well as higher rankings in freedom to make life choices. This is likely because of a positive feedback loop, as well as the fact that economic freedom often lead to freedom to do what one would like with their life. In terms of why the Nordic countries rank higher, it is likely because of this positive feedback loop between the two variables.

After examining the relationship between GDP and the freedom to make life choices, we wanted to explore further the question of GDP and happiness. Does more money equal more happiness? Despite the common assumption that this is the case, and even the multitude of scholarly articles written about how economic freedom yields personal freedom as well, we find that the actual answer is much more complicated. The horizontal graph bar above shows that even if a country is wealthy, the way they imagine happiness varies. The United States, United Arab Emirates, Saudi Arabia, Kuwait, and Hong Kong are all some of the richest countries in 2020, however, when compared with the Nordic countries Finland, Denmark, Iceland, Norway, and Sweden, we find that their formers ladder scores are significantly lower. This illustrates how GDP really isn’t the defining factor in a country’s ladder score. More money apparently doesn’t yield more opportunities. A reason for this could be that the money isn’t being used properly, or isn’t being spread out equally, and in this instance, the perceptions of corruption in a country would likely be relatively high. According to the WHR, Nordic countries have a high life satisfaction and low inequality of life satisfaction scores but the other rich countries listed above have a more unequal distribution of happiness, and the average life satisfaction in these countries is lower than in the Nordics. Nordic countries have reliable and extensive welfare benefits, low corruption, and well-functioning democracy and state institutions. This builds trust and the people are able to rely on their country. Having this type of support shows why the ladder score is so different compared to similar “rich” countries.


Another piece of information that is included in the WHR dataset, is each country’s mortality rate. The first scatter plot shows each country’s ladder score as depicted on the y-axis, and the country’s mortality rate due to homicide on the x-axis. The graph plots every country include in the WHR and shows how for the most part countries generally tend to have a low mortality rate with an average of about 10%. Generally, the countries towards the left side of the graph seem to have ladder scores of about 5, 6, or 7. When the ladder scores decrease to about 4, the mortality rate due to homicide seems to increase a bit. Despite there being a slight general trend of countries with higher ladder scores have lower mortality rates due to homicide, the trend line doesn’t seem very distinct. This would make sense because homicide doesn’t determine whether or not a country is happy. However, it could be possible that a lower trust in the government or less economic freedom could result in having higher amounts of homicide. This could be similar to the first graph where instead of creating a positive feedback loop, there is a negative feedback loop associated with countries and homicide rates. The second graph depicted above zooms in and focuses on specifically the Nordic countries. We wanted to examine whether there would be a vast range of homicide rates in these countries since that is what happens when graphing all the countries. However, we find that the homicide rates in these Nordic countries are all very similar ranging from .6-1.4 out of 80. This illustrates how while homicide rates don’t determine a country’s ladder score, the happiest countries all have very low homicide rates.

Aside from homicide rates, another piece of information included in the data set are the suicide rates. This scatter plot graphs each country included in the World Happiness report with ladder scores on the x-axis and suicide rates for both genders on the y-axis. Due to the fact that suicide may seem to be the result of untreated depression or mental illness, one would expect for the countries that have lower ladder score rankings to have higher suicide rates as well. Surprisingly though countries that have lower ladder scores tend to have generally the same suicide rates as countries with higher ladder scores. This illustrates how suicide is a much more complex issue and that suicide can be culturally informed but still very much linked to more measurable factors like GDP and other aspects of the ladder score. However, it’s also a possibility that some people in countries don’t report their suicide rates because of potential stigma. In the article “Beliefs about Suicide Acceptability in the United States: How Do They Affect Suicide Mortality?”, the authors find that the less taboo it is to talk about suicide, the more common suicide can be. (Phillips, 2018) While there is not a strong correlation between the two, the study nevertheless brings up a significant point about the taboos serving as a deterrent of a certain social behavior.
Conclusion
All our graphs explore a certain aspect of the factors that constitute happiness as defined by the WHR with a particular interest in the Nordic countries. What do Nordic countries have that other countries don’t? There doesn’t seem to be a single answer, Nordic countries have generally higher reported freedom to make life choices, as well as GDP, and they also have lower homicide and suicide rates. However, not a single one of these factors is a determinant, instead, each factor contributes to the country’s overall ladder score. While we can’t define what happiness is in this project, after examining different factors that constitute the WHR, we now have a better understanding of the importance of being well-rounded in making a country happy.
The World Happiness Report is an extremely important landmark study on subjective happiness. The report allows for cross-cultural and international comparisons about quality of life and gives a common baseline for examining the effect of policy, culture, and environment on subjective human well-being. This project raises philosophical questions about what constitutes happiness. On a more individual level, this study allows people to reflect what is important to them in comparison to what constitutes a healthy life, which could perhaps affect people’s personal attitudes towards policy making.